
Website heatmaps are a great tool to optimize conversion on your eCommerce store. These tools record and enable store owners to visualize user activity on the store. It creates a heatmap of where the user hovered, clicked, and stayed the most to help improve the User Interface and Experience (UI/UX).
Heatmaps give deep insights into people’s behaviour on the site, helping eCommerce store owners discover why users aren’t adopting/purchasing their product, using call-to-action (CTA) buttons, or converting.
Benefits of using heatmaps on your eCommerce website:
Heatmaps are valuable tools for eCommerce websites as they offer actionable insights into user behavior, help optimize website layout and design, and ultimately contribute to improving user experience and increasing conversions.
What an eCommerce website owner can learn from heatmaps?
Heatmaps help understand how to improve design, user experience, and much more. Here are a few things that heatmaps can help you optimize on your eCommerce store:
- eCommerce Heatmaps help identify user pain points and friction during checkout and simplify steps to checkout or on opt-in forms.
- Detect user conversion issues due to the addition of fees like shipping/handling.
- Understand what images are clicked and what matters for users when they view a specific product page.
- Assist you to understand whether a specific CTA is getting clicked or if it’s not grabbing attention as expected.
- Find out what elements give the impression that they are clickable elements leading to rage clicks by users. Markedly, this process helps improve the user experience.
- Understand how website elements are portrayed on different devices and optimize them accordingly to improve website conversion rate.
- Find and fix links that have broken links and wrong re-directs. This strategy is very beneficial when you have lots of products and tons of interlinking for SEO purposes.
- Understanding important content and web page sections that otherwise are ignored.
- And finally, experiencing and understanding issues across devices (Improving User Experience)
How to use heatmaps for optimal performance?
Lorem ipsum dolor sit amet, consectetur adipiscing elit. Ut elit tellus, luctus nec ullamcorper mattis, pulvinar dapibus leo.
1. The click tracking heatmap:
- Click tracking gives a visual representation of the average number of times a user clicks on each link/button on your site. If a button/link is not clicked as expected, it might be too far from the middle of the page which will reduce likelihood of user click.
- If users are not clicking, stores can also experiment with different colors to better attract their attention.
2. The move tracking heatmap:
- Mouse hover tracking heatmap helps in understanding mouse movements and identifying what catches users’ attention when they land on a website. This is also known as eye tracking as most users tend to keep the mouse where they are looking.
- Comparatively, tracking eyeballs and mouse can help sites identify if important elements on the page like the “Add to Cart” or “Buy Now” button is in the right location on the page.
3. The scroll tracking heatmap
- Use scroll tracking heatmap to understand the percentage of users that have viewed a portion of a webpage. The most important data to analyze with scroll tracking is what catches attention most of the time, where the users are waiting longer and make sure to improve that section or keep it as is depending on the performance.
Heatmap Tracking Examples
The heatmap tracking below shows where users clicked the most on one of our landing pages.

As seen in the screenshot above our form gets lots of clicks and the top 2 boxes are getting very less reasons helping us understand that our form fills are being done using autofill.
Next is the button at the bottom that scrolls to the next section of the website, this helps us understand that our UI is being conveyed well and end-users are finding it easy to use.
Furthermore, we have a few clicks on the left side content section. This helps us understand that users might be considering that text as clickable so we could potentially make changes to that section.
The below images shown is just Above the Fold (ATF) data from one of our landing pages. It conveys so much data that we can use and improve our website performance.
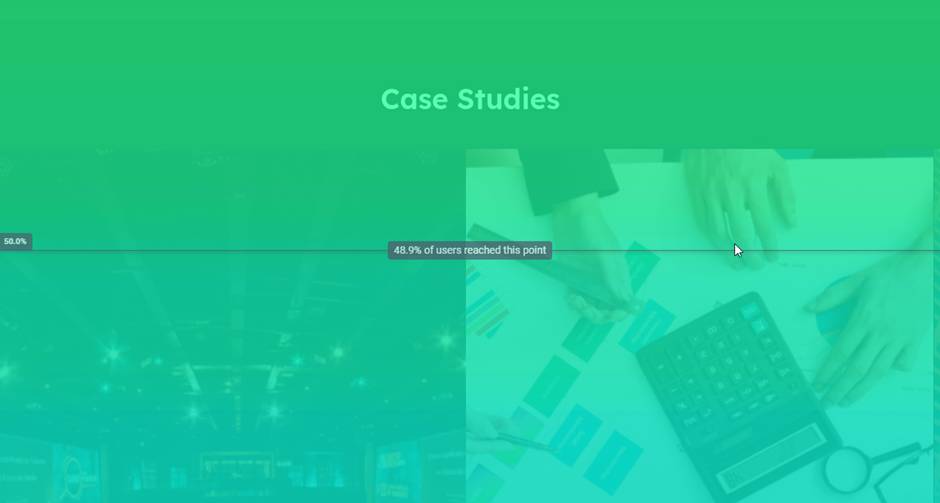
As per the scroll heatmap above it shows that 48.9% of our users on that specific landing page view 50% of our content. Are there any takeaways here? Of course!
For instance, we can make our page a little more compact so users could view more content on our landing page. Additionally, we should also analyze what content our users have missed and take a vote on whether we want to highlight that content by moving it higher on the page or not.
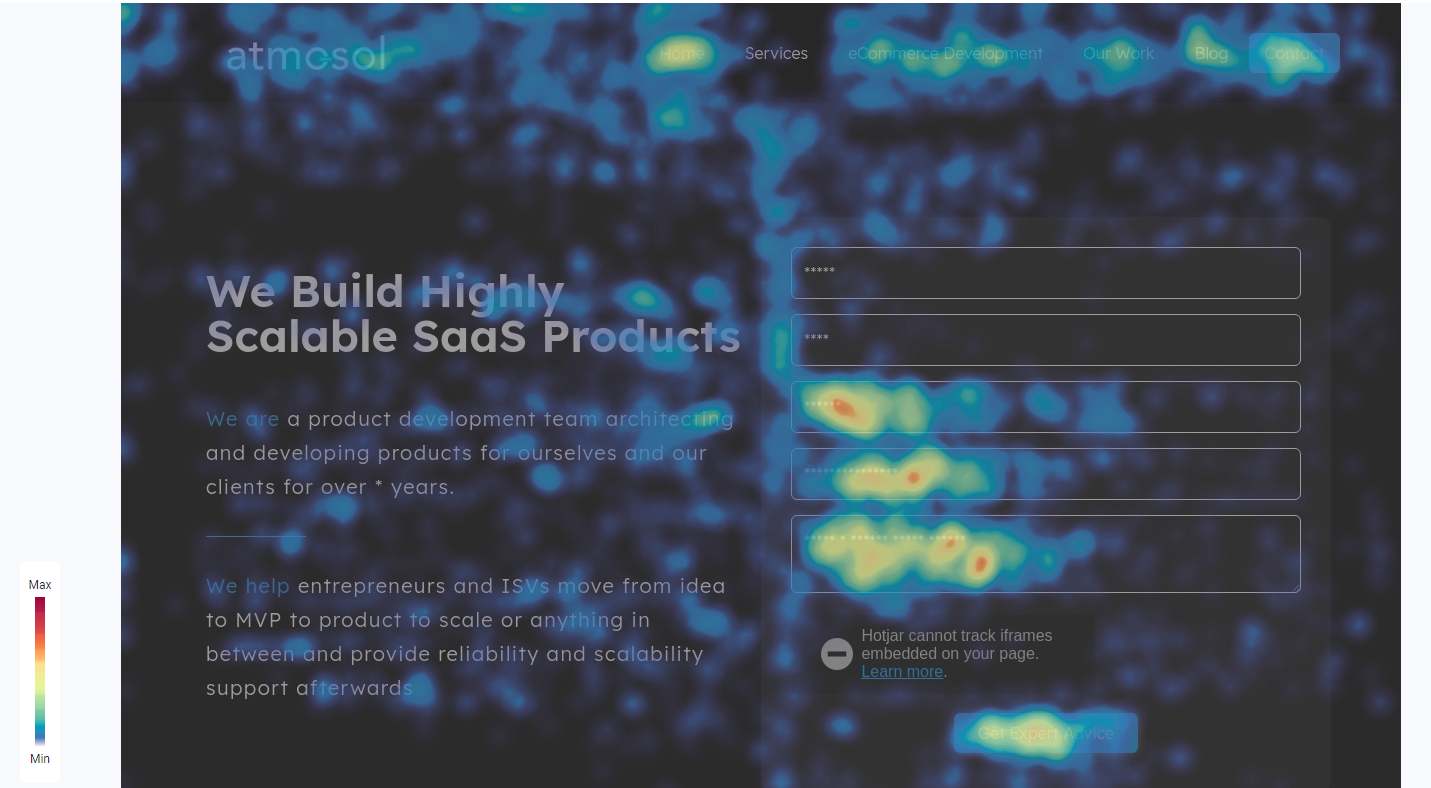
As shown in the image above the mouse movements are highlighted and areas where the mouse stopped (cursor stopped or a click happened) are highlighted areas.
On the bottom left of the image is the color scale of the heatmap from Blue to Red, Red being an extremely heated section of the page for this type of heatmap.
Best Heatmap analysis tools for your eCommerce website
1. Microsoft Clarity – Microsoft Clarity provides website usage statistics, session recordings, and heatmaps. Microsoft Clarity helps you understand how users interact with your website. Clarity Is Free Forever. Free Session Replay. Free Heatmaps.
2. Hotjar – Hotjar is an intuitive, visual way to discover, consolidate, and communicate user needs. Hotjar has three pricing plans: Basic, Plus, and Business. In addition, they also offer other plans for enterprises with requirements for scale in terms of session tracking.
3. Plerdy – Multifunctional tool that offers heatmaps, session recording, click tracking, and more to analyze user behaviour and improve site design.
4. Inspectlet – Let’s record videos of visitors as they use, click, move and scroll through the website. See every mouse movement, scroll, click, and keypress on your site. You don’t need to use traditional analytics anymore. You can know how your users are using your site in an instant.
5. CrazyEgg – Use CrazyEgg to see what’s hot and what’s not and know what your web visitors are doing with tools such as heatmaps, recordings, A/B testing & more.
Summary of eCommerce Heatmaps
A graphical representation of your user data will help in understanding how every element is being taken by the end-user and assist the web development team in making required changes to improve that experience.
For an eCommerce website, heatmaps are a vital component. The level of data they bring to the table in terms of understanding what products are being liked and clicked, what users find hard to click on and much more is important.
We believe that every website should implement this and analyze it at regular intervals to understand and improve its user experience.
If you are a business looking for a Website Speed Optimization partner, feel free to contact us.